Nice, I can confirm it no longer scrolls off the screen.
I’m planning to create a /inflation site showing peercoins YTD inflation rate.
That page would list:
-Coins minted
-Coins mined
-Coins destroyed by transaction fees
-comparison of total existing PPC now and YTD
-amount of USD needed per day/month/ytd to flow into the market to keep the current USD price
Anything else?
@mhps you’ve always been a safe bet for statistics, pinging you for that reason 
1 Like
Uhhh, https://peercoin.mintr.org/stats already has some. or the last 24hr
Blocks Found	135 (PoS:131 / PoW:4)
PPC Minted	408.88 PPC
Minutes Between Blocks	10.67
Transactions	875
Total Fees	-226.61994883 PPC
Total Transaction Output	3,902,197.265872 PPC
Coin Days Destroyed	44,198,798.6314618 => 11.32780417 Days/Coin
4 million coins transacted. The minted amount were not much more than destroyyed in tx fee!
For stats thst one cannot find anywhere yet, how about an effectivr inflation rate if you mint?
If not all coins are minting, those do mint will get more than 1% per year. Since the money supply is increasing by 1% a year due to minting, those who mint will feel that the inflation due to minting is lower.
For example there are 12% coins minting. Every full-time minter gets 8% reward from minting effectively. Consider the 1% moneysupply inflation and POW inflatioin and tx fee deflation rate , the net inflation for full-time minters can be very low or even negative.
A realtime minting rate followed by effective minter’s inflation is a great way to motivate minting.
I was hoping to do something similar if only I had the time, which I don’t at te moment. It would be nice to have some statistics. In particular I was thinking about some charts such as:
- Annualised inflation rate over the last 7 days or so.
- Total coin supply
- Estimated transaction volume
- PoW reward
- PoW difficulty and PoS difficulty.
Yes… that would be nice. But I think that sum is including change outputs.
The PoS reward is based upon the coin-age of the coins being minted, and so if fewer people are minting the inflation rate would be lower. The reward is given like this:
 int64 GetProofOfStakeReward(int64 nCoinAge)
{
    static int64 nRewardCoinYear = CENT;  // creation amount per coin-year
    int64 nSubsidy = nCoinAge * 33 / (365 * 33 + 8) * nRewardCoinYear;
    return nSubsidy;
}
I don’t understand the point of * 33 / (365 * 33 + 8) and why it isn’t simply something like nCoinAge / 365 * nRewardCoinYear but maybe someone can enlighten me.
Edit: * 33 / (365 * 33 + 8) is used to get a precise Gregorian year.
That is why – I saw another fee of 9ppc in the 24hr block stat section later and wondered…
OK the above calculation may be too naiive, but can an effective inflation be had based on examining
block history?
It’s hard to estimate future inflation as the rewards and transaction fees will fluctuate over time. However a figure representing annualised inflation can be obtained. For instance, to acquire an annualised inflation over the last 7 days you can do something like:
A = Coins now
B = Coins 7 days ago
C = Coins minted in last 7 days
Inflation = (((C+B)/B) ^ 52.178 - 1 + (A-C-B)*52.178/B)*100
That would calculate the annualised inflation over the last 7 days from minting using compounding (because PoS minting is proportional to the number of coins) and all other inflation from PoW and fees linearly.
2 Likes
@willy, I added your block explorer list website to the Reddit sidebar and in the main sticky thread here.
1 Like
https://www.peercoinexplorer.net/inflation/
Charts are yet to come, I need to collect the data to present.
1 Like
You may also now follow the Twitter bot posting the data every 24 hours:
Retweeted on the main account.
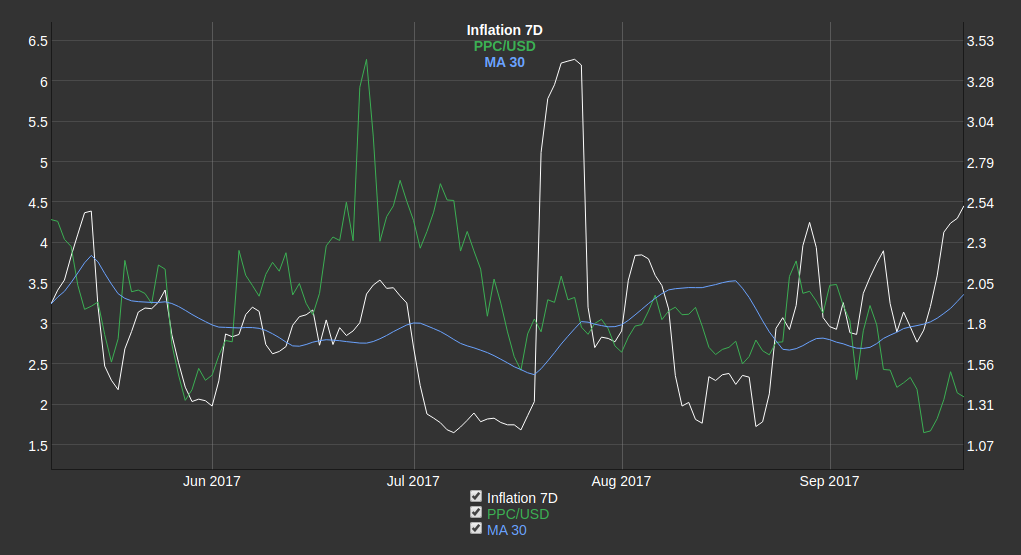
A chart for the 7 day annualized inflation rate is now live:
https://www.peercoinexplorer.net/inflation/
1 Like
A chart for the Year to date (YTD) inflation rate is now live:
https://www.peercoinexplorer.net/inflation/
1 Like
Added a MA 30 chart for the 7D inflation rate.
Seems to make inflation prediction much easier.
Hey people,
https://www.peercoinexplorer.net/forkwatch/
is now live.
It will show you the current status of the v0.6 soft fork.
Thanks @hrobeers for the forkwatch python script.
Willy
3 Likes
This probably deserves its own thread.
Sure, we could use a thread like “soft fork discussion.”
1 Like
I’ve noticed people linking to
https://explorer.peercoin.net
in the chat. It looks pretty nice, but I can’t seem to find an announcement anywhere.
Thoughts?
We generally like to keep it low volume